
The Delta Zig Zag indicator for mt5 (Metatrader 5) draws the zigzag price pattern formations and support/resistance levels on the main trading chart.
The indicator can be used as a standalone trading tool for both trade entry and exit and does not repaint.
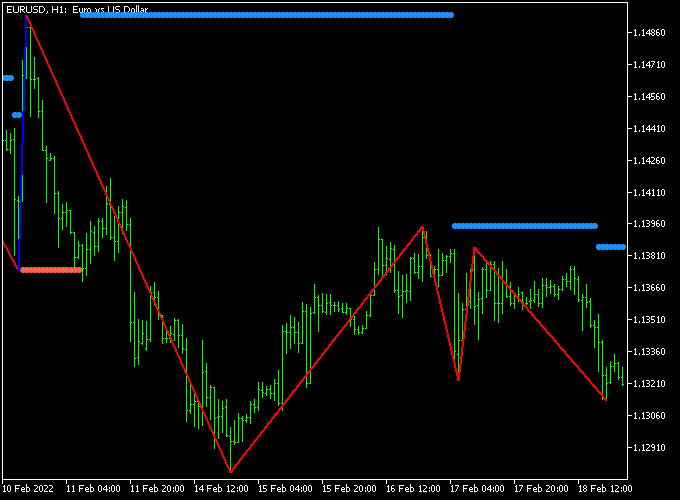
It’s easy to identify support and resistance levels with this indicator (blue and red horizontal lines)
The Delta Zig Zag Forex indicator performs the best when combined with trend indicators.
The indicator works equally well on all currency pairs (majors, minors and exotic) and shows promising results if used correctly.
Free Download:
Download the “deltazigzag.mq5” indicator for MT5
Indicator Example Chart (EUR/USD H1)
The example chart below shows the Delta Zig Zag Forex indicator in action on the MT5 trading platform.
Trading Tips:
Feel free to use your own favorite trade entry, stop loss and take profit strategy when trading with the ZigZag Forex indicator.
As always, trade in agreement with the overall trend and practice on a demo account first until you fully understand this indicator.
Please note that even the best trading indicator cannot yield a 100% win rate over long periods.
Indicator Specifications & Inputs:
Trading Platform: Developed for Metatrader 5 (MT5)
Trading Instruments: Works for Forex, Stocks, Commodities, Equity Indices, Precious Metals, Energies and Shares
Time frames: Works for any time frame
Trade Style: Works for scalping, day trading and swing trading
Input Parameters: Variable (inputs tab), color settings & style
Indicator type: Support & resistance
Does the indicator repaint? No.
Download Now:
Download the “deltazigzag.mq5” indicator for Metatrader 5
How to install this indicator on Metatrader 5?
Open the Metatrader 5 platform
From the top menu, click on “File”
Then click on “Open Data Folder”
Then double click with your mouse button on “MQL5”
Now double click on “Indicators”
Paste the indicator in the Indicators folder.
Finally restart the MT5 platform and attach the indicator to any chart.
How to remove the indicator?
Right click with your mouse on the chart that you have the indicator attached to.
Select “Indicator List” from the drop down menu.
Select the indicator and press delete.
How to edit the indicator’s inputs and parameters?
Right click with your mouse on the chart that you have the indicator attached to.
From the drop down menu, click on indicators list.
Select the indicator from the list and press edit.
Now you can edit the indicator.
Finally, press the OK button to save the updated configuration.