The Value Chart oscillator developed for Metatrader 5 shows overbought and oversold market conditions on the chart.
The indicator loads in a separate chart window as a red colored line that oscillates between the extremes 15 and -15 trading levels .
To identify overbought and oversold levels in the market:
- The market is considered oversold when the indicator reaches or surpasses the -8 value.
- The market is considered overbought when the indicator reaches or surpasses the 8 value.
Users can customize the indicator’s settings and parameters, including the indicator period and line color.
It is advised to demo trade with this technical oscillator until you fully understand how it works.
Keep in mind that its trading performance may fluctuate based on market conditions, so it’s crucial to maintain realistic expectations.
Download Indicator 🆓
value_charts_single_jj.mq5 Indicator (MT5)
Chart Example
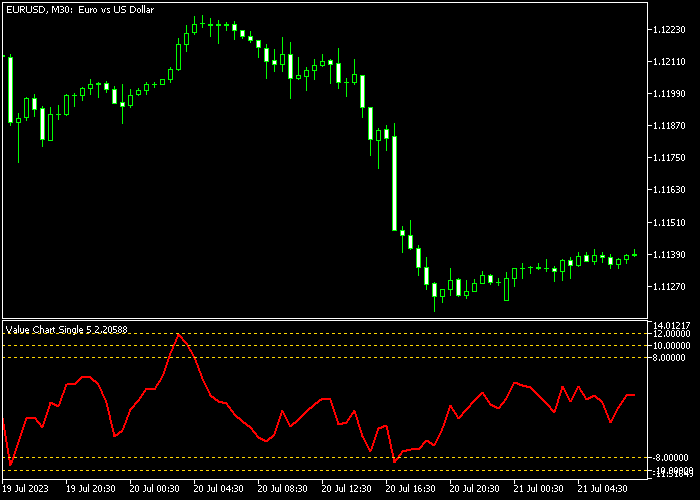
Here is what the Value Chart oscillator indicator looks like when applied to the MT5 charting platform.

How To Buy And Sell Currency Pairs With The Value Chart Oscillator?
Find a simple trading strategy below:
Buy Signal
- Buy condition: the market should show a clear uptrend.
- Enter the buy trade when the Value Chart oscillator crosses back above -8 from below.
- Exit the buy trade for a risk to reward ratio of at least 1.5.
- Alternatively, close the buy trade when it reaches a predetermined fixed take profit target.
Sell Signal
- Sell condition: the market should show a clear downtrend.
- Enter the buy trade when the Value Chart oscillator crosses back below 8 from above.
- Exit the sell trade for a risk to reward ratio of at least 1.5.
- Alternatively, close the sell trade when it reaches a predetermined fixed take profit target.
Download Now 🆓
value_charts_single_jj.mq5 Indicator (MT5)
Frequently Asked Questions
How Do I Install This Custom Indicator On Metatrader 5?
- Open the MT5 trading platform
- Click on the File menu button located at the top left part of the platform
- Click on Open Data Folder > MQL5 folder > Indicators
- Copy the value_charts_single_jj.mq5 indicator file in the Indicators folder
- Close and restart the trading platform
- You will find the indicator here (Navigator window > Indicators)
- Drag the indicator to the chart to get started with it!
How Do I Edit This Indicator?
- Click in the open chart with your right mouse button
- In the dropdown menu, click on Indicator List
- Select the indicator and click on properties
- Now you can edit the inputs, colors, levels, scale and visualization
- Finally click the OK button to save the new configuration