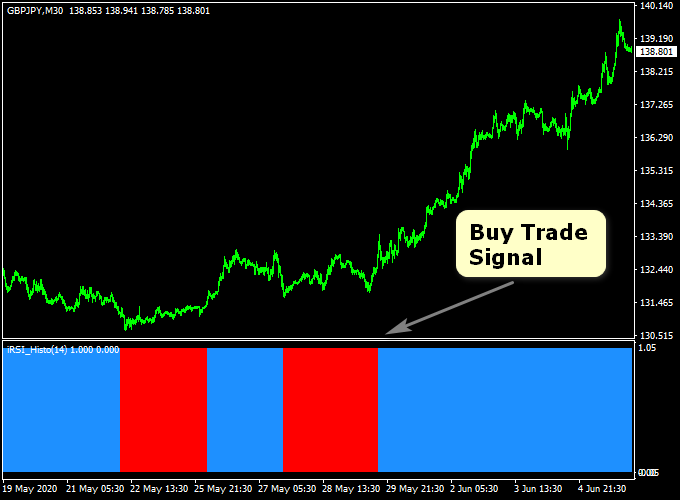
The advanced iRSI Histogram Forex indicator provides profitable buy and sell signals that work for majors and currency cross pairs.
As the name implies, the iRSI indicator is based on the RSI technical trading indicator.
Trading with the iRSI Forex indicator is very simple, even for newbies.
The iRSI indicator suits all currency pairs and time frames.
Trade Logic
- A blue iRSI colored histogram represents a buy trend.
- A red iRSI colored histogram represents a sell trend.
For scalping and day trading, use during the London and US trading sessions.
For swing trading, it’s recommended to use on the higher time frames only (H1, H4 and D1).
Feel free to experiment with the different iRSI Forex indicator’s inputs settings to suit your needs and preferences.
Free Download
Download the “iRSI_Advanced_Histo_v1.0.ex4” MT4 indicator
Example Chart
The GBP/JPY 30-Minute chart below displays the Advanced iRSI Histogram Metatrader 4 Forex indicator in action.
Basic Trading Signals
Signals from the Advanced iRSI Histogram Buy/Sell MT4 indicator are easy to interpret and goes as follows:
Buy Signal: Buy the currency pair when the colored iRSI Histogram indicator draws its first blue histogram bar on the activity chart. The trend is now in buy mode.
Place initial stop loss 1-3 pips below previous swing support, or use your own preferred SL method.
Take profit when the first red iRSI sell bar appears on the chart, or go for a fixed profit target. For example, 20 pips on the M5 trading chart.
Sell Signal: Sell the currency pair when the colored iRSI Histogram indicator draws its first red histogram bar on the activity chart. The trend is now in sell mode.
Place initial stop loss 1-3 pips above previous swing resistance, or use your own preferred SL method.
Take profit when the first blue iRSI buy bar appears on the chart, or go for a fixed profit target. For example, 50 pips on the M30 trading chart.
Download
Download the “iRSI_Advanced_Histo_v1.0.ex4” Metatrader 4 indicator
MT4 Indicator Characteristics
Currency pairs: Any
Platform: Metatrader 4
Type: chart window indicator
Customization options: Variable (period indicator, level trend up, level trend down) Width & Style.
Time frames: 1-Minute, 5-Minutes, 15-Minutes, 30-Minutes, 1-Hour, 4-Hours, Daily, Weekly, Monthly
Type: RSI
Installation
Copy and paste the iRSI_Advanced_Histo_v1.0.ex4 indicator into the MQL4 indicators folder of the Metatrader 4 trading platform.
You can access this folder from the top menu as follows:
File > Open Data Folder > MQL4 > Indicators (paste here)


