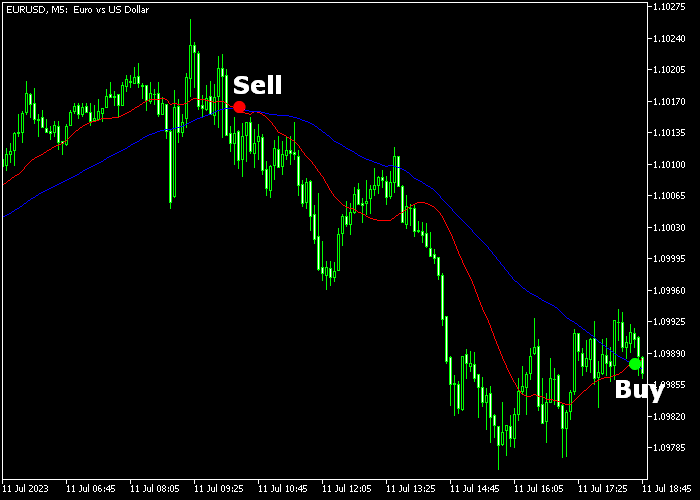
The DJ Market Pro indicator designed for Metatrader 5 generates accurate buy and sell signals for any Forex pair and time frame.
DJ Market Pro produces reliable trend signals by incorporating moving averages and the CCI indicator in its trading formula.
Key features include:
- A green arrow indicates a buy signal.
- A red arrow indicates a sell signal.
- DJ Market Pro is suitable for all trading styles.
- The signals provided are 100% non-repaint.
Furthermore, this indicator offers customization options to cater to individual preferences.
Users can adjust the fast MA period, slow MA period, CCI period, horizontal shift, and colors to their liking.
DJ Market Pro can be effectively utilized as a standalone tool for buy/sell signals.
Download Indicator 🆓
Chart Example
The following picture shows how the DJ Market Pro indicator looks like when applied to the MT5 chart.
How To Buy And Sell Forex Pairs Utilizing The DJ Market Pro Indicator?
Find a simple trading example below:
Buy Signal
- The green colored DJ Market Pro arrow generates a buy signal.
- Execute a buy market order and set a protective stop below swing support.
- Exit the buy trade for a potential reward to risk ratio of 1.5.
- An alternative approach is to consider taking profit when a red colored sell arrow appears on the chart.
Sell Signal
- The red colored DJ Market Pro arrow generates a sell signal.
- Execute a sell market order and set a protective stop above swing resistance.
- Exit the sell trade for a potential reward to risk ratio of 1.5.
- An alternative approach is to consider taking profit when a green colored buy arrow appears on the chart.
Download Now 🆓
Frequently Asked Questions
How Do I Install This Custom Indicator On Metatrader 5?
- Open the MT5 trading platform
- Click on the File menu button located at the top left part of the platform
- Click on Open Data Folder > MQL5 folder > Indicators
- Copy the nduet.mq5 indicator file in the Indicators folder
- Close and restart the trading platform
- You will find the indicator here (Navigator window > Indicators)
- Drag the indicator to the chart to get started with it!
How Do I Edit This Indicator?
- Click in the open chart with your right mouse button
- In the dropdown menu, click on Indicator List
- Select the indicator and click on properties
- Now you can edit the inputs, colors, levels, scale and visualization
- Finally click the OK button to save the new configuration


