
The Entropy indicator is designed for MT5 and delivers accurate trade entry signals and exit signals for any currency pair and time frame.
The indicator gets displayed in a separate chart window as an oscillator that provides bullish and bearish market sentiment.
How does it work?
- Signals are formed when the zero line is crossed.
- A bullish market sentiment occurs when the Entropy indicator crosses back above 0.
- A bearish market sentiment occurs when the Entropy indicator crosses back below 0.
The following indicator inputs and variables can be modified: entropy period, colors, style.
Tip: combine the indicator with other technical analysis tools to increase the probability of successful Forex trades.
Familiarize yourself with the Entropy indicator and conduct thorough testing on a demo account before trading live with it.
Download Indicator 🆓
Chart Example
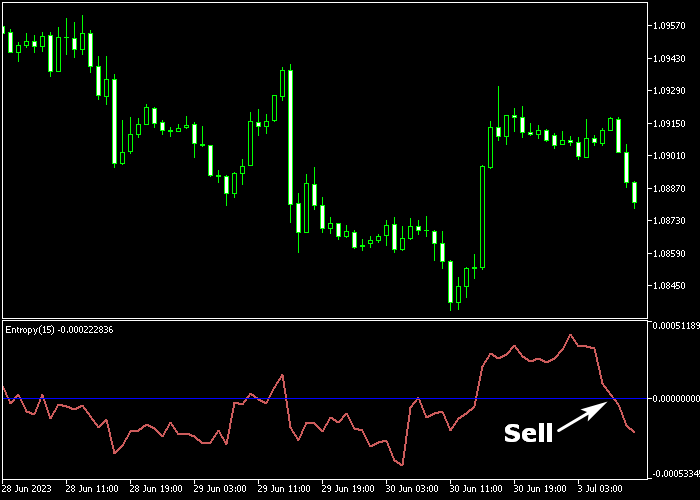
The picture below shows how the Entropy Forex indicator looks like when applied to the MT5 chart.
How To Buy And Sell Forex Pairs With The Entropy Indicator?
Find a simple trading example below:
Buy Signal
- A buy signal is confirmed when the Entropy indicator crosses back above 0 from below.
- Open a buy trade and place a stop loss 3 pips below short-term support.
- Close the buy trade for a fixed pips profit target, for example, +18 pips on the M5 chart.
- Optional: hold the buy trade until a sell signal appears on the chart.
Sell Signal
- A sell signal is confirmed when the Entropy indicator crosses back below 0 from above.
- Open a sell trade and place a stop loss 3 pips above short-term resistance.
- Close the sell trade for a fixed pips profit target, for example, +30 pips on the M30 chart.
- Optional: hold the sell trade until a buy signal appears on the chart.
Download Now 🆓
Frequently Asked Questions
How Do I Install This Custom Indicator On Metatrader 5?
- Open the MT5 trading platform
- Click on the File menu button located at the top left part of the platform
- Click on Open Data Folder > MQL5 folder > Indicators
- Copy the entropy.mq5 indicator file in the Indicators folder
- Close and restart the trading platform
- You will find the indicator here (Navigator window > Indicators)
- Drag the indicator to the chart to get started with it!
How Do I Edit This Indicator?
- Click in the open chart with your right mouse button
- In the dropdown menu, click on Indicator List
- Select the indicator and click on properties
- Now you can edit the inputs, colors, levels, scale and visualization
- Finally click the OK button to save the new configuration