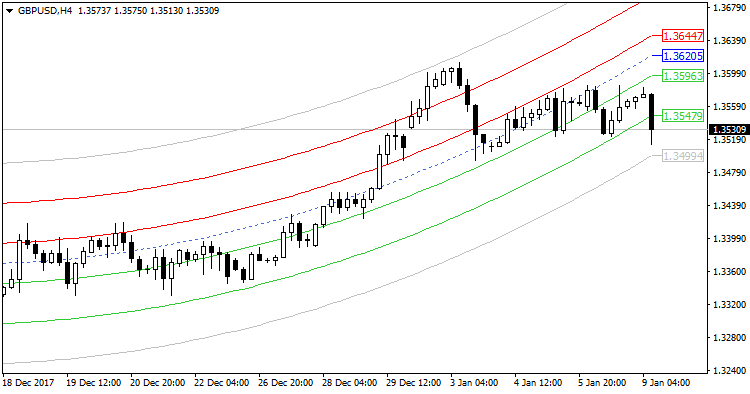
The Center of Gravity v3 metatrader 4 indicator consists of a center line and multiple bands that show oversold and overbought trading zones.
The green lines tell us when the price is considered to be oversold. On the contrary, the red lines tell us when the price is considered to be overbought.
The theory goes that the price will always retrace back to the center line of the indicator. That’s why it’s called “center of gravity”
Free Download
Download the “Center of Gravity v 3.mq4” MT4 indicator
Example Chart
The GBP/USD H4 chart below shows the Center of Gravity v3 forex indicator in action.
Basic Trading Signals
First and foremost, you will need to watch how the Center of Gravity indicator behaves.
If the lines are pointing up, it means the trend goes up. You will buy only.
If the lines are pointing down, it means the trend goes down. You will sell only.
Buy: The price reaches the green oversold lines in the uptrend.
Sell: The price reaches the red overbought lines in the downtrend.
Download
Download the “Center of Gravity v 3.mq4” Metatrader 4 indicator
MT4 Indicator Characteristics
Currency pairs: Any
Platform: Metatrader 4
Type: chart pattern indicator
Customization options: Variable (Bars Back, Method, Beginning, Multiplier) Colors, width & Style.
Time frames: 1-Minute, 5-Minutes, 15-Minutes, 30-Minutes, 1-Hour, 4-Hours, 1-Day, 1-Week, 1-Month
Type: Gravity
Installation
Copy and paste the Center of Gravity v 3.mq4 indicator into the MQL4 indicators folder of the Metatrader 4 trading platform.
You can access this folder from the top menu as follows:
File > Open Data Folder > MQL4 > Indicators (paste here)


