
The Simple Support & Resistance Breakout indicator for Metatrader 5 can be used as a support & resistance breakout signal indicator.
The indicator calculates the best support and resistance level and then plots both S & R levels on the price chart.
Key takeaways:
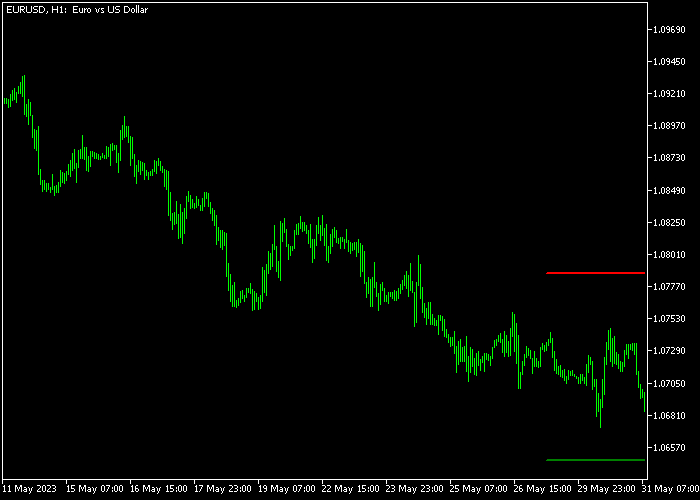
- The green colored line represents support.
- Sell a break below support (in downtrends).
- The red colored line represents resistance.
- Buy a break above resistance (in uptrends).
The following indicator inputs can be modified: period, lines length, and colors.
Please make yourself familiar with this technical indicator and test it first on a demo account for an extended period
It supports all time frames and Forex pairs.
Download Indicator 🆓
Simple_Support_Resistance.mq5 Indicator (MT5)
Chart Example
The following chart shows how the Simple Support & Resistance Breakout indicator looks when applied to the MT5 chart.
How To Buy And Sell Forex Pairs With The Simple Support & Resistance Breakout Indicator?
Find a simple trading example below:
Buy Signal
- The market should be in an uptrend.
- Buy a candle close above the green colored resistance line.
- Open a buy trade and place your stop loss 3 pips below the previous swing support.
- Close the buy trade for a reward-to-risk ratio of at least 2.0, or go for a fixed profit target.
Sell Signal
- The market should be in a downtrend.
- Sell a candle close below the red colored support line.
- Open a sell trade and place your stop loss 3 pips above the previous swing resistance.
- Close the sell trade for a reward-to-risk ratio of at least 2.0, or go for a fixed profit target.
Download Now 🆓
Simple_Support_Resistance.mq5 Indicator (MT5)
Frequently Asked Questions
How Do I Install This Custom Indicator On Metatrader 5?
- Open the MT5 trading platform
- Click on the File menu button located at the top left part of the platform
- Click on Open Data Folder > MQL5 folder > Indicators
- Copy the Simple Simple_Support_Resistance.mq5 indicator file in the Indicators folder
- Close and restart the trading platform
- You will find the indicator here (Navigator window > Indicators)
- Drag the indicator to the chart to get started with it!
How Do I Edit This Indicator?
- Click in the open chart with your right mouse button
- In the dropdown menu, click on Indicator List
- Select the indicator and click on properties
- Now you can edit the inputs, colors, levels, scale and visualization
- Finally click the OK button to save the new configuration