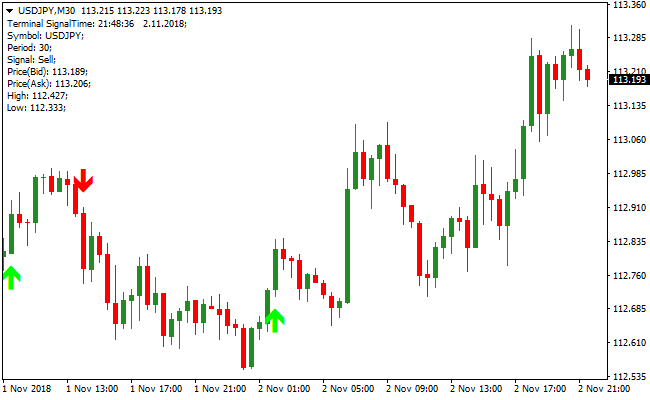
The Gann Signal MT4 indicator draws buy and sell signal arrows based on the famous Gann chart pattern.
This makes it easy for everyone to take advantage of Gann chart patterns, even without knowing anything about Gann.
- A green arrow represents a bullish Gann chart pattern.
- A red arrow represents a bearish Gann chart pattern.
In order to yield great results with the Gann Signal indicator, use it together with a trend following indicator.
Feel free to combine it with a moving average, Bollinger Bands, or any other trend following indicator of your personal preference.
In an upward trend, trade the green Gann arrows and ignore the red ones.
In a downward trend, trade the red Gann arrows and ignore the green ones.
Free Download
Download the “gann-signal-indicator.mq4” MT4 indicator
Example Chart
The USD/JPY 30-minute chart below displays the Gann Signal Metatrader 4 indicator in action.
Basic Trading Signals
Signals from the Gann Signal MT4 indicator are easy to interpret and goes as follows:
Buy Signal: Open buy trade position when a green Gann arrow pops up on the chart and the overall trend is upward. A stop-loss should be placed below the previous swing low price.
Sell Signal: Open sell trade position when a red Gann arrow pops up on the chart and the overall trend is downward. A stop-loss should be placed above the previous swing high price.
Trade Exit : Use your own method of trade exit.
Download
Download the “gann-signal-indicator.mq4” Metatrader 4 indicator
MT4 Indicator Characteristics
Currency pairs: Any
Platform: Metatrader 4
Type: Chart pattern indicator
Customization options: Variable (periods, sound, ras) Colors, width & Style.
Time frames: 1-Minute, 5-Minutes, 15-Minutes, 30-Minutes, 1-Hour, 4-Hours, 1-Day, 1-Week, 1-Month
Type: trend
Installation
Copy and paste the gann-signal-indicator.mq4 into the MQL4 indicators folder of the Metatrader 4 trading platform.
You can access this folder from the top menu as follows:
File > Open Data Folder > MQL4 > Indicators (paste here)


