
The Blau TSI Forex Trade Signal indicator for Metatrader 5 represents a non-repaint trend signal generator based on the true strength index.
The indicator gets displayed in a separate chart window as a blue and orange colored filled signal line.
How does it work?
- A blue colored filled signal line marks an uptrend.
- An orange colored filled signal line marks a downtrend.
The following indicator inputs and parameters can be modified: true strength index momentum smoothing period, true strength index smoothing period 2, and price.
For scalping and intraday traders: the indicator tends to produce the best results during the London and American trading sessions.
Make yourself familiar with this technical indicator and test it first on a demo account for an extended period.
Download Indicator 🆓
Blau – tsi trade.mq5 Indicator (MT5)
Chart Example
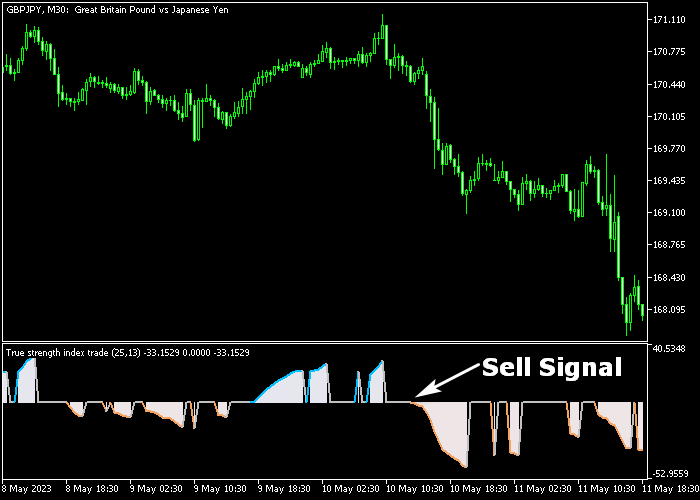
The following chart shows how the Blau TSI Forex Trade Signal indicator looks when applied to the MT5 chart.
How To Buy And Sell Currency Pairs With The Blau TSI Forex Trade Signal Indicator?
Find a simple trading example below:
Buy Signal
- The appearance of the blue colored filled line is a buy trade signal.
- Open a buy trade and place your stop loss slightly below support.
- Close the buy trade for a risk/reward ratio of at least 1:1, or wait for a sell signal.
Sell Signal
- The appearance of the orange colored filled line is a sell trade signal (see chart above).
- Open a sell trade and place your stop loss slightly above resistance.
- Close the sell trade for a risk/reward ratio of at least 1:1, or wait for a buy signal.
Download Now 🆓
Blau – tsi trade.mq5 Indicator (MT5)
Frequently Asked Questions
How Do I Install This Custom Indicator On Metatrader 5?
- Open the MT5 trading platform
- Click on the File menu button located at the top left part of the platform
- Click on Open Data Folder > MQL5 folder > Indicators
- Copy the Blau – tsi trade.mq5 indicator file in the Indicators folder
- Close and restart the trading platform
- You will find the indicator here (Navigator window > Indicators)
- Drag the indicator to the chart to get started with it!
How Do I Edit This Indicator?
- Click in the open chart with your right mouse button
- In the dropdown menu, click on Indicator List
- Select the indicator and click on properties
- Now you can edit the inputs, colors, levels, scale and visualization
- Finally click the OK button to save the new configuration