The Stochastic Fan Forex indicator for Metatrader 5 is a solid momentum oscillator that works similarly to the slow Stochastic indicator.
The indicator identifies overbought and oversold market levels as follows:
- The market is oversold when the indicator reading reaches the 20 value.
- The market is overbought when the indicator reading reaches the 80 value.
To customize the indicator, you can adjust inputs and parameters such as the fan color, type of period calculation, number of fan lines, K period, D period, Stochastic line and colors.
The indicator can be utilized for any trading instrument supported by the Metatrader 5 charting platform.
It is advisable to familiarize yourself with the Stochastic Fan indicator and thoroughly test it on a demo account.
Download Indicator 🆓
Chart Example
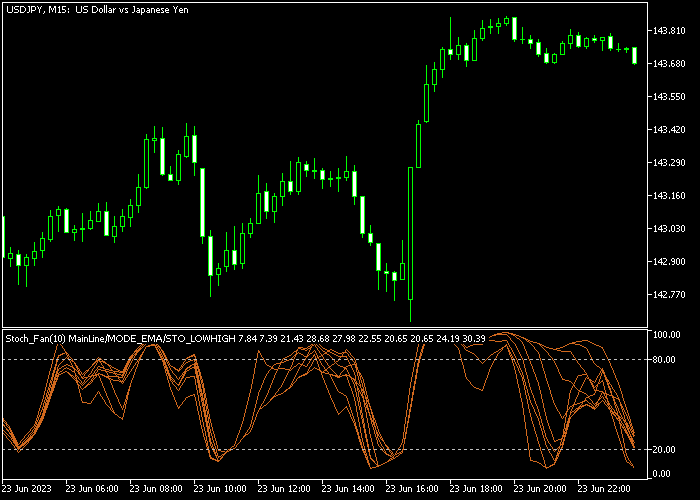
The picture below illustrates how the Stochastic Fan indicator looks like when applied to the MT5 chart.

How To Buy And Sell Currency Pairs With The Stochastic Fan Forex Indicator?
Find a simple trading strategy below:
Buy Signal
- Buy market condition: the market trend must demonstrate a clear uptrend.
- Open a buy trade when the Stochastic fan lines cross back above the 20 level from below.
- Take profit method 1: exit the buy trade for a profit target of your preference.
- Take profit method 2: exit the buy trade when the Stochastic fan lines reach the 80 overbought level.
Sell Signal
- Sell market condition: the market trend must demonstrate a clear downtrend.
- Open a sell trade when the Stochastic fan lines cross back below the 80 level from above.
- Take profit method 1: exit the sell trade for a profit target of your preference.
- Take profit method 2: exit the sell trade when the Stochastic fan lines reach the 20 oversold level.
Download Now 🆓
Frequently Asked Questions
How Do I Install This Custom Indicator On Metatrader 5?
- Open the MT5 trading platform
- Click on the File menu button located at the top left part of the platform
- Click on Open Data Folder > MQL5 folder > Indicators
- Copy the _fanstoch.mq5 indicator file in the Indicators folder
- Close and restart the trading platform
- You will find the indicator here (Navigator window > Indicators)
- Drag the indicator to the chart to get started with it!
How Do I Edit This Indicator?
- Click in the open chart with your right mouse button
- In the dropdown menu, click on Indicator List
- Select the indicator and click on properties
- Now you can edit the inputs, colors, levels, scale and visualization
- Finally click the OK button to save the new configuration