
The AFIRMA Forecaster Signal indicator for Metatrader 5 serves as a tool for forecasting future market trends in any currency pair.
The indicator appears in the main chart as a 2 color forecasting signal line.
How to buy and sell with the Afirma indicator?
- A purple line suggests a bullish market trend, buy the currency pair.
- A red line signifies a bearish market trend, sell the currency pair.
This indicator works equally well for any time frame of your preference.
You have the flexibility to modify the following indicator inputs and parameters: LF transmission width, number of delay units in the filter, window index, shift, and colors.
Familiarize yourself with this technical indicator and test it first on a demo account before applying it to a real account.
It supports all time frames and Forex pairs.
Download Indicator 🆓
Chart Example
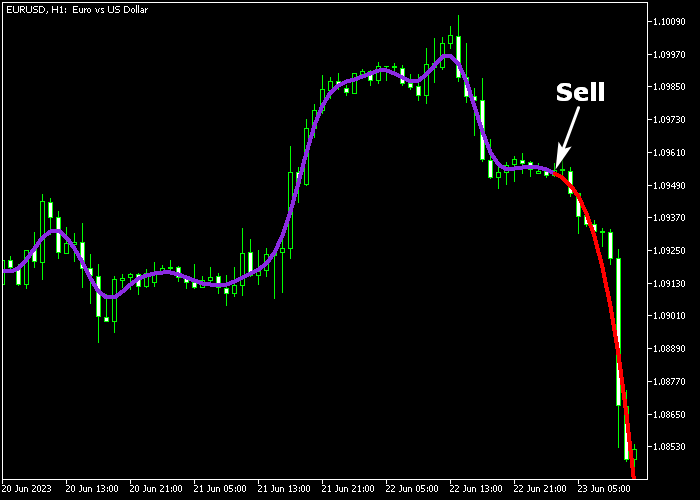
The picture below illustrates what the AFIRMA Forecaster Signal indicator looks like when applied to the MT5 chart.
How To Buy And Sell Forex Pairs With The AFIRMA Forecaster Signal Indicator?
Find a simple trading example below:
Buy Signal
- A buy signal occurs when the purple colored Afirma line gets displayed on the price chart.
- Open a buy market order and place your stop 2-3 pips below support.
- Close the buy trade for a fixed take profit target, or hold the buy trade and wait for the red colored Afirma line.
Sell Signal
- A sell signal occurs when the red colored Afirma line gets displayed on the price chart.
- Open a sell market order and place your stop 2-3 pips above resistance.
- Close the sell trade for a fixed take profit target, or hold the sell trade and wait for the purple colored Afirma line.
Download Now 🆓
Frequently Asked Questions
How Do I Install This Custom Indicator On Metatrader 5?
- Open the MT5 trading platform
- Click on the File menu button located at the top left part of the platform
- Click on Open Data Folder > MQL5 folder > Indicators
- Copy the afirma.mq5 indicator file in the Indicators folder
- Close and restart the trading platform
- You will find the indicator here (Navigator window > Indicators)
- Drag the indicator to the chart to get started with it!
How Do I Edit This Indicator?
- Click in the open chart with your right mouse button
- In the dropdown menu, click on Indicator List
- Select the indicator and click on properties
- Now you can edit the inputs, colors, levels, scale and visualization
- Finally click the OK button to save the new configuration