
The Correlation Candles oscillator designed for Metatrader 5 delivers robust buying and selling trade signals to all kinds of traders.
The Correlation Candles oscillator is displayed in a dedicated chart as a sequence of colored candles that oscillate above and below the zero line.
How to trade the trend with this technical tool?
- An uptrend occurs when the candles trade above 0.
- A downtrend occurs when the candles trade below 0.
The following indicator inputs and parameters can be modified: correlation rank, and correlation type (spearman).
Please make yourself familiar with this technical indicator and test it first on a practice account before applying it to a live account.
It supports all time frames and Forex pairs.
Download Indicator 🆓
Correlation_candles.mq5 Indicator (MT5)
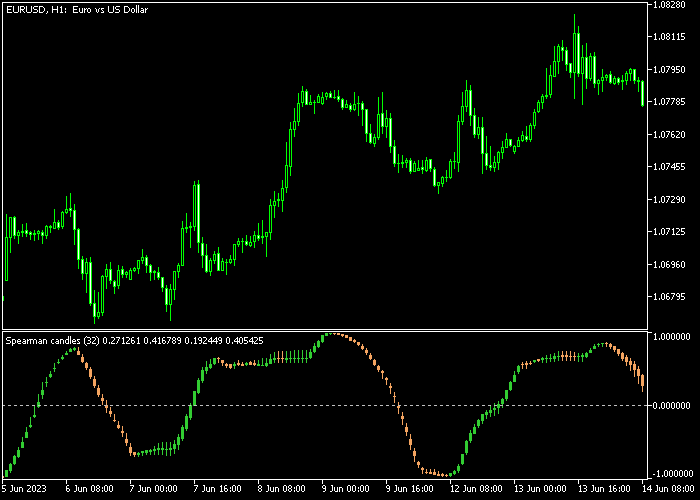
Chart Example
The following chart shows how the Correlation Candles oscillator looks when applied to the MT5 chart.
How To Buy And Sell Currency Pairs With The Correlation Candles Oscillator?
Find a simple trading example below:
Buy Signal
- Open a buy trade when the Correlation Candles oscillator crosses the 0 level bottom up.
- Add a stop loss order below technical support.
- Exit the buy trade for a predetermined pips target, or wait for a sell signal and reverse the position.
Sell Signal
- Open a sell trade when the Correlation Candles oscillator crosses the 0 level top down.
- Add a stop loss order above technical resistance.
- Exit the sell trade for a predetermined pips target, or wait for a buy signal and reverse the position.
Download Now 🆓
Correlation_candles.mq5 Indicator (MT5)
Frequently Asked Questions
How Do I Install This Custom Indicator On Metatrader 5?
- Open the MT5 trading platform
- Click on the File menu button located at the top left part of the platform
- Click on Open Data Folder > MQL5 folder > Indicators
- Copy the Correlation_candles.mq5 indicator file in the Indicators folder
- Close and restart the trading platform
- You will find the indicator here (Navigator window > Indicators)
- Drag the indicator to the chart to get started with it!
How Do I Edit This Indicator?
- Click in the open chart with your right mouse button
- In the dropdown menu, click on Indicator List
- Select the indicator and click on properties
- Now you can edit the inputs, colors, levels, scale and visualization
- Finally click the OK button to save the new configuration