
The Hans Forex Breakout System indicator for Metatrader 5 is a solid trading system that provides buy & sell trade entries based on significant price levels.
The indicator appears on the chart as colored boxes.
The idea is simple and based on calculated price levels for both buy and sell trade entries.
The indicator is newbie-friendly and it can be used by anyone, regardless of trading experience.
How it works?
- A price close above the Hans box is a bullish signal.
- A price close below the Hans box is a bearish signal.
The indicator contains the following inputs and parameters: colors, style, and others.
First, familiarize yourself with this technical indicator and test it on a demo account.
It supports all time frames and Forex pairs.
Download Indicator 🆓
Hans_Indicator_Cloud_System.mq5 Indicator (MT5)
Chart Example
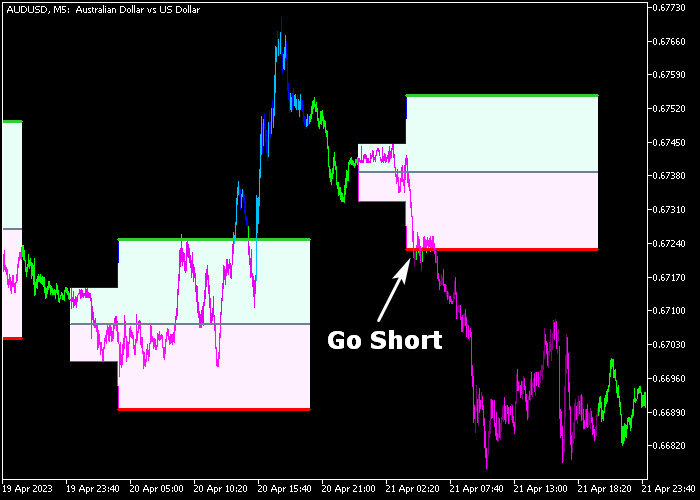
The following chart shows what the Hans Forex Breakout System indicator looks like when applied to the MT5 chart.
How To Buy And Sell Forex Pairs With The Hans Forex Breakout System Indicator?
Find a simple trading example below:
Buy Signal
- A price close above the green colored Hans box is a buy signal.
- Open a buy trade and place your stop loss below the low of the Hans box.
- Exit the buy trade for a fixed profit target or wait until price reaches key resistance.
Sell Signal
- A price close below the violet colored Hans box is a sell signal.
- Open a sell trade and place your stop loss above the high of the Hans box.
- Exit the sell trade for a fixed profit target or wait until price reaches key support.
Download Now 🆓
Hans_Indicator_Cloud_System.mq5 Indicator (MT5)
Frequently Asked Questions
How Do I Install This Custom Indicator On Metatrader 5?
- Open the MT5 trading platform
- Click on the File menu button located at the top left part of the platform
- Click on Open Data Folder > MQL5 folder > Indicators
- Copy the Hans_Indicator_Cloud_System.mq5 indicator file in the Indicators folder
- Close and restart the trading platform
- You will find the indicator here (Navigator window > Indicators)
- Drag the indicator to the chart to get started with it!
How Do I Edit This Indicator?
- Click in the open chart with your right mouse button
- In the dropdown menu, click on Indicator List
- Select the indicator and click on properties
- Now you can edit the inputs, colors, levels, scale and visualization
- Finally click the OK button to save the new configuration