The T3 Floating Level Signal Forex indicator for Metatrader 5 creates buy and sell signals on the chart using two different T3 trading methods.
It uses the original T3 calculation Tim Wilson method and the modified Bob Fulks method.
The Bob Fulks T3 calculation method is less lagging the price.
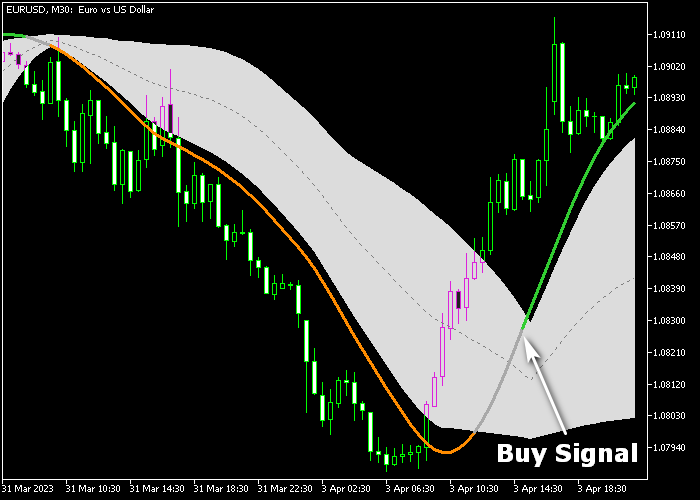
The indicator is displayed in the main chart as a gray colored cloud along with a buy/sell signal line.
How to spot trend direction with this indicator?
- The trend is upward when the green colored line gets printed on the chart.
- The trend is downward when the orange colored line gets printed on the chart.
- The gray colored line represents a neutral trend.
The indicator contains the following inputs and parameters: T3 period, T3 volume factor, T3 calculation mode, average price, colors, upper level %, lower level %.
First, familiarize yourself with this technical indicator and test it on a demo account.
It supports all time frames and Forex pairs.
Download Indicator 🆓
T3 floating levels (2).mq5 Indicator (MT5)
Chart Example
The following chart shows what the T3 Floating Level Signal indicator looks like when applied to the MT5 chart.

How To Buy And Sell Forex Pairs With The T3 Floating Level Signal Forex Indicator?
Find a simple trading example below:
Buy Signal
- A bullish signal is given when the green colored signal line appears on the main chart.
- Open a buy transaction and place your stop loss below technical support.
- Close the buy trade for a fixed take profit target, or wait for the gray colored signal line.
Sell Signal
- A bearish signal is given when the orange colored signal line appears on the main chart.
- Open a sell transaction and place your stop loss above technical resistance.
- Close the sell trade for a fixed take profit target, or wait for the gray colored signal line.
Download Now 🆓
T3 floating levels (2).mq5 Indicator (MT5)
Frequently Asked Questions
How Do I Install This Custom Indicator On Metatrader 5?
- Open the MT5 trading platform
- Click on the File menu button located at the top left part of the platform
- Click on Open Data Folder > MQL5 folder > Indicators
- Copy the T3 floating levels (2).mq5 indicator file in the Indicators folder
- Close and restart the trading platform
- You will find the indicator here (Navigator window > Indicators)
- Drag the indicator to the chart to get started with it!
How Do I Edit This Indicator?
- Click in the open chart with your right mouse button
- In the dropdown menu, click on Indicator List
- Select the indicator and click on properties
- Now you can edit the inputs, colors, levels, scale and visualization
- Finally click the OK button to save the new configuration