
The SSL Channel Chart indicator for Metatrader 5 is a trading channel that provides easy to spot trade entry and exit signals.
The indicator appears as a colored channel in the main chart screen.
Buying and selling Forex pairs is easy with the SSL Channel Chart Forex indicator!
Key Points:
- A bullish trend occurs when the SSL Channel indicator is sloping up.
- A bearish trend occurs when the SSL Channel indicator is sloping down.
- A price breakout above or below the channel creates a signal.
The following indicator inputs and parameters can be modified: method, Lb, style, and color.
First, familiarize yourself with this technical indicator and test it on a demo account.
It supports all time frames and Forex pairs.
Download Indicator 🆓
SSL_Channel_Chart.mq5 Indicator (MT5)
Chart Example
The following chart shows what the SSL Channel Chart Forex indicator looks like when applied to the MT5 chart.
How To Buy And Sell Forex Pairs With The SSL Channel Chart Indicator?
Find a simple trading example below:
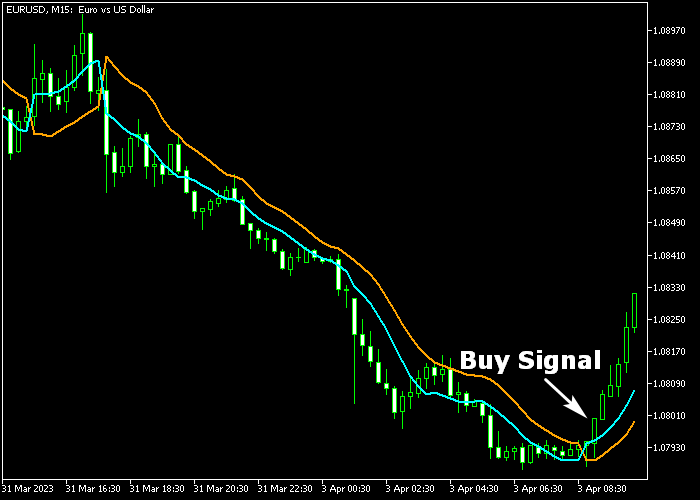
Buy Signal
- The SSL trading channel must be sloping up (bullish trend)
- The candlestick closes above the blue upper SSL channel line.
- Open a buy trade and place a stop loss below the lower orange channel line.
- Close the buy trade for a fixed take profit target of your preference, or wait for a sell signal.
Sell Signal
- The SSL trading channel must be sloping down (bearish trend)
- The candlestick closes below the orange lower SSL channel line.
- Open a sell trade and place a stop loss above the upper blue channel line.
- Close the sell trade for a fixed take profit target of your preference, or wait for a buy signal.
Download Now 🆓
SSL_Channel_Chart.mq5 Indicator (MT5)
Frequently Asked Questions
How Do I Install This Custom Indicator On Metatrader 5?
- Open the MT5 trading platform
- Click on the File menu button located at the top left part of the platform
- Click on Open Data Folder > MQL5 folder > Indicators
- Copy the SSL_Channel_Chart.mq5 indicator file in the Indicators folder
- Close and restart the trading platform
- You will find the indicator here (Navigator window > Indicators)
- Drag the indicator to the chart to get started with it!
How Do I Edit This Indicator?
- Click in the open chart with your right mouse button
- In the dropdown menu, click on Indicator List
- Select the indicator and click on properties
- Now you can edit the inputs, colors, levels, scale and visualization
- Finally click the OK button to save the new configuration