
The Dynamic Pivot Points Forex indicator for Metatrader 5 updates all pivot levels dynamically for any time frame and can be used for trade entry and exit.
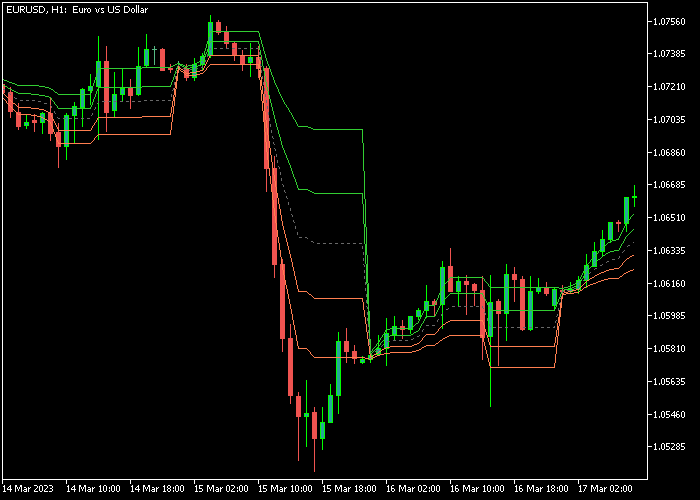
The indicator appears on the main screen and paints 3 dynamic pivot point levels on the chart.
- The price is considered bullish above the middle pivot point (gray dotted line) while bearish below.
- The green colored pivot point levels act as resistance
- The orange colored pivot point levels act as support.
The default time frame for pivot point calculation is set to the daily time frame but it can be changed by editing the indicator’s inputs.
The following indicator inputs can be modified: time frame, pivot level 1, pivot level 2, pivot level 3, use alternative calculation.
First, familiarize yourself with this technical indicator and test it on a demo account.
It supports all time frames and Forex pairs.
Download Indicator 🆓
Dynamic pivots (any time frame).mq5 Indicator (MT5)
Chart Example
The following chart shows how the Dynamic Pivot Points indicator looks like when applied to the MT5 chart.
How To Buy And Sell Forex Pairs With The Dynamic Pivot Points Indicator?
Find a simple trading example below:
Buy Signal
- A bullish trend occurs when price closes above the middle pivot point.
- Open a buy trade and place a stop loss below the lower orange colored pivot point.
- Exit the buy trade at the upper green colored pivot point.
Sell Signal
- A bearish trend occurs when price closes below the middle pivot point.
- Open a sell trade and place a stop loss above the upper green colored pivot point.
- Exit the sell trade at the lower orange colored pivot point.
Download Now 🆓
Dynamic pivots (any time frame).mq5 Indicator (MT5)
Frequently Asked Questions
How Do I Install This Custom Indicator On Metatrader 5?
- Open the MT5 trading platform
- Click on the File menu button located at the top left part of the platform
- Click on Open Data Folder > MQL5 folder > Indicators
- Copy the Dynamic pivots (any time frame).mq5 indicator file in the Indicators folder
- Close and restart the trading platform
- You will find the indicator here (Navigator window > Indicators)
- Drag the indicator to the chart to get started with it!
How Do I Edit This Indicator?
- Click in the open chart with your right mouse button
- In the dropdown menu, click on Indicator List
- Select the indicator and click on properties
- Now you can edit the inputs, colors, levels, scale and visualization
- Finally click the OK button to save the new configuration