
The HLC Trend Confirmation Signal Forex Indicator for Metatrader 5 is built on moving averages and provides trend trading signals.
The indicator appears in a separate chart window as two colored lines that can be used as a classic crossover trading system.
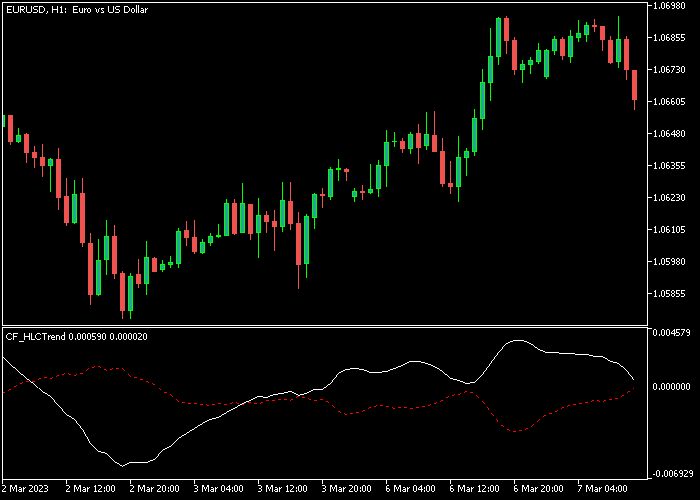
- The trend is bullish when the white MA line is positioned above the red dotted MA line.
- The trend is bearish when the white MA line is positioned below the red dotted MA line.
The following inputs can be edited: moving average method, high MA period, low MA period, and close MA period.
Tip: the HLC indicator can be easily combined with technical oscillators.
Make yourself familiar with this indicator and test it first on a demo account. It supports all time frames and Forex pairs.
Download Indicator 🆓
CF_HLCTrend.mq5 Indicator (MT5)
Chart Example
The following chart shows what the HLC Trend Confirmation Signal indicator looks like when applied to the MT5 chart.
How To Buy And Sell Forex Pairs With The HLC Trend Confirmation Signal Forex Indicator?
Find a simple trading example below:
Buy Signal
- A buy signal occurs when the white colored MA line crosses the red dotted MA line bottom-up.
- Open a buy transaction and set a stop loss order below the most recent swing low.
- Close the buy trade when a sell signal occurs on the chart.
Sell Signal
- A sell signal occurs when the white colored MA line crosses the red dotted MA line top-down.
- Open a sell transaction and set a stop loss order above the most recent swing high.
- Close the sell trade when a buy signal occurs on the chart.
Download Now 🆓
CF_HLCTrend.mq5 Indicator (MT5)
Frequently Asked Questions
How Do I Install This Custom Indicator On Metatrader 5?
- Open the MT5 trading platform
- Click on the File menu button located at the top left part of the platform
- Click on Open Data Folder > MQL5 folder > Indicators
- Copy the CF_HLCTrend.mq5 indicator file in the Indicators folder
- Close and restart the trading platform
- You will find the indicator here (Navigator window > Indicators)
- Drag the indicator to the chart to get started with it!
How Do I Edit This Indicator?
- Click in the open chart with your right mouse button
- In the dropdown menu, click on Indicator List
- Select the indicator and click on properties
- Now you can edit the inputs, colors, levels, scale and visualization
- Finally click the OK button to save the new configuration