The Schaff Trend Cycle indicator for Metatrader 4 gauges overbought/oversold market conditions for any currency pair.
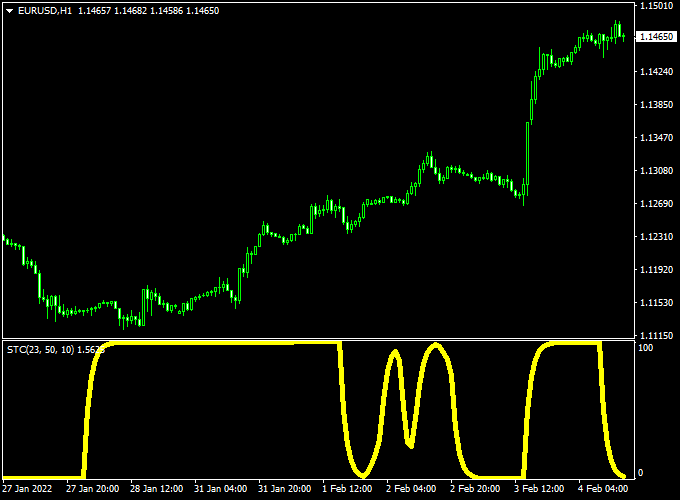
The indicator pops up in a separate MT4 chart window as a yellow colored signal line that oscillates between 0 and 100.
The value 0 is oversold, while 100 is overbought.
Schaff Trend Cycle is a very reliable technical oscillator, lightweight, and will not slow down your trading platform.
Buy & Sell Trade Example
- Open a buy order when the Schaff Trend Cycle value reaches 0 and the market is in an uptrend.
- Open a sell order when the Schaff Trend Cycle value reaches 100 and the market is in a downtrend.
The indicator works equally well on all currency pairs (majors, minors and exotic) and shows promising results if used correctly.
Free Download
Download the “SchaffTrendCycle.mq4” indicator for MT4
Indicator Chart (EUR/USD H1)
The picture below shows the Schaff Trend Cycle mt4 indicator in action on the trading chart.

Trading Tips:
As always, trade in agreement with the overall trend and practice on a demo account first until you fully understand this indicator.
Please note that even the best trading indicator cannot yield a 100% win rate over long periods.
Indicator Specifications & Inputs:
Trading Platform: Developed for Metatrader 4 (MT4)
Currency pairs: Works for any pair
Time frames: Works for any time frame
Trade Style: Works for scalping, day trading and swing trading
Input Parameters: Variable (inputs tab), color settings & style
Indicator type: Oscillator
Does the indicator repaint? No.
Schaff Trend Cycle + Flat Trend Forex Scalping Strategy
This MT4 scalping strategy combines the Schaff Trend Cycle Forex Indicator with the Flat Trend Indicator.
It focuses on identifying short bursts of momentum in trending markets, allowing traders to capture quick moves on lower timeframes like M1, M5, and M15.
The Schaff Trend Cycle provides precise oscillator-based reversal timing, while the Flat Trend Indicator filters out false entries by confirming trend direction using color bars.
The Schaff Trend Cycle shows oversold and overbought levels with values between 0 and 100.
When the oscillator reaches 0 and crosses above 20, it signals a potential bullish reversal.
Conversely, when it reaches 100 and crosses below 80, it signals a potential bearish reversal.
The Flat Trend Indicator displays green bars for bullish conditions and red bars for bearish conditions.
When both indicators align, traders get reliable, high-probability scalping entries.
Buy Entry Rules
- Wait until the Schaff Trend Cycle reaches 0 and crosses above 20, showing the start of upward momentum.
- Confirm that the Flat Trend Indicator bars are green, indicating a bullish market.
- Enter a buy position on the next candle after both conditions align.
- Set a stop loss a few pips below the most recent swing low or support area.
- Take profit around 10-20 pips for M1 or M5 charts, or 25-30 pips on M15 charts.
- Close the trade early if the Flat Trend bars switch to red or if the Schaff Trend Cycle reaches 100.
Sell Entry Rules
- Wait until the Schaff Trend Cycle reaches 100 and crosses below 80, showing downward momentum.
- Confirm that the Flat Trend Indicator bars are red, indicating a bearish market.
- Enter a sell position on the next candle after both conditions align.
- Set a stop loss a few pips above the latest swing high or resistance area.
- Take profit around 10-20 pips on M1 or M5 charts, or 25-30 pips on M15 charts.
- Exit the trade if the Flat Trend bars switch to green or if the Schaff Trend Cycle dips to 0.
Advantages
- Combines oscillator timing with trend confirmation for stronger entries.
- Effective for short-term scalping on major currency pairs like EUR/USD, GBP/USD, and USD/JPY.
- Quick identification of reversals using Schaff Trend Cycle’s smooth, responsive signals.
- Flat Trend Indicator visually simplifies trend direction, reducing confusion during high-speed trading.
- Ideal for traders seeking multiple trades per session with controlled risk.
Drawbacks
- Requires discipline to avoid trading against the color of the Flat Trend Indicator.
- Profit potential per trade is small, so spreads and commissions matter more.
- Lag may occur in rapidly reversing markets where the oscillator reacts slightly late.
Example Case Study 1: EUR/USD M5 Chart
During the London session, EUR/USD dropped into oversold territory, with the Schaff Trend Cycle reaching 0.
Once it crossed above 20, the Flat Trend Indicator bars turned green.
A buy trade was opened at 1.0850, stop loss set at 1.0835 (15 pips), and take profit at 1.0872 (22 pips).
Within 40 minutes, the price reached the target as momentum accelerated upward.
This example shows how the strategy catches early reversals with confirmation.
Example Case Study 2: GBP/USD M1 Chart
On a volatile M1 chart, GBP/USD hit overbought levels with the Schaff Trend Cycle near 100.
When it crossed below 80, the Flat Trend Indicator turned red, confirming a sell setup.
A sell order was entered at 1.2760 with a stop loss at 1.2776 (16 pips) and a take profit at 1.2740 (20 pips).
The move was completed in 12 minutes, generating a clean scalp profit before the next retracement.
Strategy Tips
- Trade during active sessions (London and New York) to benefit from stronger momentum and faster execution.
- Avoid flat or consolidating markets where the Flat Trend bars constantly change colors.
- Keep spreads low by focusing on major pairs and using ECN brokers for better entry accuracy.
- Use a trailing stop once the trade is in profit to secure gains without closing too early.
- Test the setup on a demo first to find the optimal take-profit distance for each pair.
- Do not overtrade; limit trades to setups where both indicators are clearly aligned.
By using the Schaff Trend Cycle and Flat Trend Indicator together, this MT4 scalping strategy offers clear, disciplined trading opportunities across multiple pairs.
It’s especially effective for traders who prefer short bursts of trading activity with controlled, repeatable results.
Download Now
Download the “SchaffTrendCycle.mq4” indicator for Metatrader 4


