
The RAVI Forex Oscillator for Metatrader 4 is a technical indicator that provides rapid entry and exit signals on the chart.
Scalpers and day traders can benefit from the RAVI indicator.
The indicator pops up in a separate MT4 chart window as an orange colored line that oscillates above and below the 0.00 neutral level.
RAVI is very reliable, lightweight, and will not slow down your trading platform.
Buy & Sell Trade Example
- Open a buy trade when the orange line crosses back above the 0.00 level from below.
- Open a sell trade when the orange line crosses back below the 0.00 level from above.
The indicator works equally well on all currency pairs (majors, minors and exotic) and shows promising results if used correctly.
Free Download
Download the “RAVI.mq4” indicator for MT4
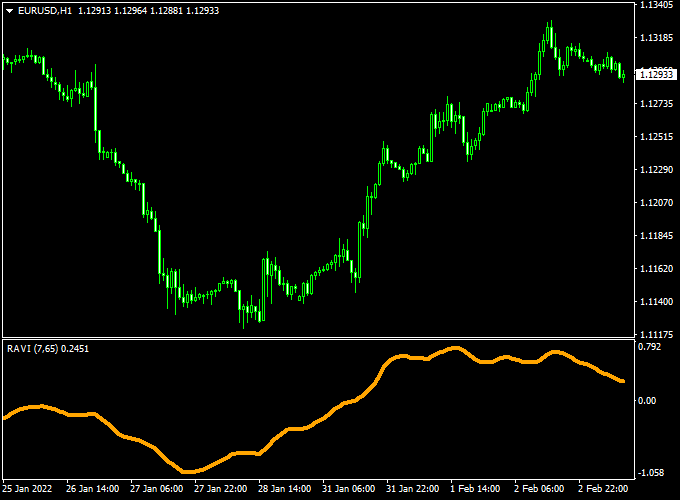
Indicator Chart (EUR/USD H1)
The picture below shows the RAVI Forex Oscillator mt4 indicator in action on the trading chart.
Trading Tips:
Feel free to use your own favorite trade entry, stop loss and take profit method to trade with the RAVI Forex Oscillator indicator.
As always, trade in agreement with the overall trend and practice on a demo account first until you fully understand this indicator.
Please note that even the best trading indicator cannot yield a 100% win rate over long periods.
Indicator Specifications & Inputs:
Trading Platform: Developed for Metatrader 4 (MT4)
Currency pairs: Works for any pair
Time frames: Works for any time frame
Trade Style: Works for scalping, day trading and swing trading
Input Parameters: Variable (inputs tab), color settings & style
Indicator type: Oscillator
Does the indicator repaint? No.
Ravi Oscillator + Zero Lag MACD Forex Scalping Strategy
This scalping strategy combines the Ravi Forex Oscillator Indicator with the Zero Lag MACD Indicator to catch short-term price movements.
The Ravi Oscillator signals entries when the orange line crosses above 0.00 for buys and below 0.00 for sells.
The Zero Lag MACD confirms trend direction: a histogram above 0 indicates a bullish trend and below 0 indicates a bearish trend.
Combining both helps traders enter trades in alignment with the trend while spotting quick scalping opportunities.
This strategy works best on 5-minute and 15-minute charts during active trading sessions.
It is suitable for volatile pairs such as EUR/GBP, USD/JPY, and AUD/USD.
Buy Entry Rules
- Wait for the orange Ravi Oscillator line to cross back above the 0.00 level from below.
- Confirm that the Zero Lag MACD histogram is above 0, indicating a bullish trend.
- Enter a buy trade at the close of the confirmation candle.
- Set a stop loss 10–15 pips below the recent swing low or the last support level.
- Set take profit 15–25 pips or exit when the histogram turns negative or the oscillator crosses below 0.00.
Sell Entry Rules
- Wait for the orange Ravi Oscillator line to cross back below the 0.00 level from above.
- Confirm that the Zero Lag MACD histogram is below 0, indicating a bearish trend.
- Enter a sell trade at the close of the confirmation candle.
- Set a stop loss 10–15 pips above the recent swing high or the last resistance level.
- Set take profit 15–25 pips or exit when the histogram turns positive or the oscillator crosses above 0.00.
Advantages
- Combines momentum reversal signals with trend confirmation for higher-probability trades.
- Can be used on multiple currency pairs with reliable intraday volatility.
- Works well for both 5-minute and 15-minute scalping charts.
- Helps traders avoid entering trades against the main trend.
- Easy to interpret, even for traders new to oscillators and MACD.
Drawbacks
- Oscillator signals can produce false entries in choppy or range-bound markets.
- The MACD histogram may lag slightly, delaying confirmation in fast trends.
- Frequent small losses may occur if trades are not filtered properly by trend confirmation.
Example Case Study 1 – EUR/GBP
On the M5 chart, the orange Ravi Oscillator crossed above 0.00 at 0.8572, with the Zero Lag MACD histogram above 0.
A buy trade was entered at 0.8573, stop loss at 0.8560, and take profit at 0.8595.
The trade reached the target within 22 minutes, gaining +22 pips.
Example Case Study 2 – AUD/USD
On the M15 chart, the orange Ravi Oscillator crossed below 0.00 at 0.6785, with the Zero Lag MACD histogram below 0.
A sell trade was entered at 0.6783, stop loss at 0.6798, and take profit at 0.6765.
The trade hit the target within 35 minutes, yielding +18 pips.
Strategy Tips
- Only take trades when both the Ravi Oscillator and Zero Lag MACD confirm direction.
- Focus on high-volatility sessions to maximize scalping effectiveness.
- Consider using a trailing stop if the trade moves quickly in your favor.
- Backtest the strategy on different currency pairs to identify which respond best to oscillator and trend alignment.
- Maintain a trading journal to track entry timing and adjust pip targets based on volatility.


