
The Optimized AMA trend following indicator for MT4 is an optimized version of the original AMA technical forex indicator.
This optimized version draws blue buy and red sell dots on the activity chart.
AMA Buy and sell trading signals are easy to understand, even for absolute beginners:
- A buy signal occurs when the AMA indicator draws blue dots on the MT4 chart
- A sell signal occurs when the AMA indicator draws red dots on the MT4 chart
The Optimized AMA trend following indicator can be used as a standalone tool or together with other analysis tools.
Scalpers, day traders and swing traders can benefit from the Optimized AMA technical indicator.
The default settings can be changed directly from the indicator’s inputs tab.
Free Download
Download the “ama-optimized-indicator.mq4” MT4 indicator
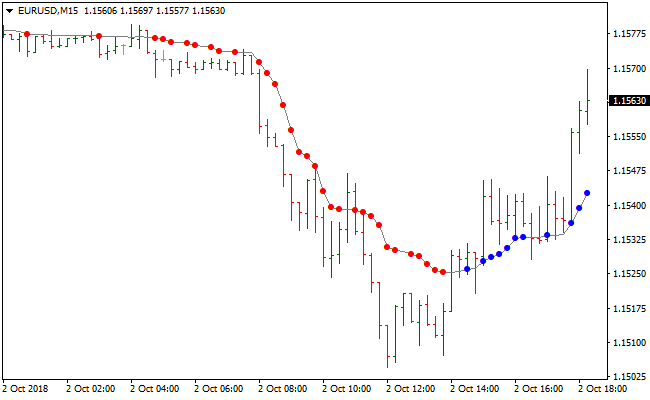
Indicator Chart (EUR/USD M15)
The EUR/USD 15-Minute chart below displays the Optimized AMA Metatrader 4 Forex indicator in action.
Basic Trading Signals
Signals from the Optimized AMA MT4 forex indicator are easy to interpret and go as follows:
Buy Signal: Go long when the AMA dot changes color from red to blue (trend up).
Sell Signal: Go short when the AMA dot changes color from blue to red (trend down).
Trade Exit: Close the open buy/sell trade when an opposite signal occurs, or use your own method of trade exit.
Optimized AMA + Murrey Math Support and Resistance Forex Strategy
This MT4 strategy combines the Optimized AMA MT4 indicator and the Murrey Math Support and Resistance MT4 indicator.
The Optimized AMA indicator provides buy and sell signals with blue dots for bullish trades and red dots for bearish trades.
The Murrey Math indicator draws support and resistance levels which can be used to trade market bias.
In bullish trends, buy trades are taken near support levels and profits are taken near the next resistance.
In bearish trends, sell trades are taken near resistance levels and profits are taken near the next support.
This strategy works well on M15 and H1 charts and is suitable for major currency pairs with clear intraday trends.
Buy Entry Rules
- The Optimized AMA indicator displays a blue dot, signaling a buy opportunity.
- The overall trend is bullish, identified by price staying above key Murrey Math support levels.
- Enter a long trade after the blue dot appears and price is near or bouncing off a Murrey Math support level.
- Place a stop loss a few pips below the nearest Murrey Math support line.
- Take profit near the next Murrey Math resistance level or allow the trade to run while the bullish trend remains strong.
Sell Entry Rules
- The Optimized AMA indicator displays a red dot, signaling a sell opportunity.
- The overall trend is bearish, identified by price staying below key Murrey Math resistance levels.
- Enter a short trade after the red dot appears and price is near or rejecting from a Murrey Math resistance level.
- Place a stop loss a few pips above the nearest Murrey Math resistance line.
- Take profit near the next Murrey Math support level or let the trade run while the bearish trend remains strong.
Advantages
- Combines precise entry signals from Optimized AMA with trend bias and levels from the Murrey Math indicator.
- Clear guidance for both bullish and bearish trends using support and resistance levels.
- Effective on multiple currency pairs, including EURUSD, GBPUSD, USDJPY, and AUDUSD.
- Works on M15 and H1 charts, suitable for intraday and short-term swing trading.
- Allows traders to manage exits based on actual market structure rather than fixed risk-to-reward rules.
Drawbacks
- Less effective in choppy or range-bound markets where the price frequently oscillates between levels.
- Stop losses may be triggered by sudden spikes near support or resistance levels.
- Requires patience to wait for the signal dot near the key Murrey Math levels.
Example Case Study 1 (EURUSD M15 bullish trade)
On EURUSD M15, a blue dot appeared from the Optimized AMA indicator at 1.1050.
The overall trend was bullish, with price bouncing near the Murrey Math support line at 1.1045.
A long trade was entered at 1.1052 with a stop loss at 1.1040.
Price moved to the next Murrey Math resistance at 1.1075, capturing 23 pips.
The bullish trend remained intact, allowing the trade to continue to 1.1085 for additional profit.
Example Case Study 2 (GBPUSD H1 bearish trade)
On GBPUSD H1, a red dot appeared from the Optimized AMA indicator at 1.2655.
The overall trend was bearish, with price rejecting near the Murrey Math resistance at 1.2660.
A short trade was entered at 1.2654 with a stop loss at 1.2670.
Price declined to the next Murrey Math support level at 1.2620, capturing 34 pips.
The bearish trend continued, allowing further downward movement to 1.2605 for additional profit.
Strategy Tips
- Focus on trading pairs with strong intraday trends for better signal reliability.
- Wait for Optimized AMA dots to appear near Murrey Math levels to improve entry accuracy.
- Monitor higher time frame trends to align trades with the main market direction.
- Use trailing stops once the trade moves in your favor to maximize profits while respecting support and resistance levels.
- Trade during active market sessions when price respects Murrey Math levels for more predictable moves.
- Use multiple time frame analysis to filter entries and ensure trend consistency.
Download Now
Download the “ama-optimized-indicator.mq4” Metatrader 4 indicator
MT4 Indicator Characteristics
Currency pairs: Any
Platform: Metatrader 4
Type: Chart pattern indicator
Customization options: Variable (period AMA, nfast, nslow, G, dK, Price type, Ama trend type) Colors, width & Style.
Time frames: 1-Minute, 5-Minutes, 15-Minutes, 30-Minutes, 1-Hour, 4-Hours, 1-Day, 1-Week, 1-Month
Type: trend


