About the Double MACD Indicator
The Double MACD Forex Indicator for MetaTrader 4 is a momentum and trend tool. It overlays two MACD calculations on the same chart.
This gives clearer confirmation of direction and strength.
One MACD uses shorter EMA periods (fast). The other uses longer EMA periods (slow).
Together, they help filter false signals. They highlight trades where short-term momentum matches the main trend.
The indicator plots histogram bars and signal-line crossovers for both MACDs.
At a glance, you can see if short-term momentum supports the longer-term trend.
Free Download
Download the “Double MACD.ex4” indicator for MT4
Key Features
- Two MACD calculations on one indicator (fast MACD + slow MACD) for multi-time momentum confirmation.
- Histogram and signal lines for both MACDs with optional smoothing settings.
- Configurable EMA periods, signal periods, and histogram visualization options.
- Works on all MT4 timeframes and symbols — default settings tuned for FX majors.
- Lightweight and non-repainting — suitable for mechanical strategies and manual trading.
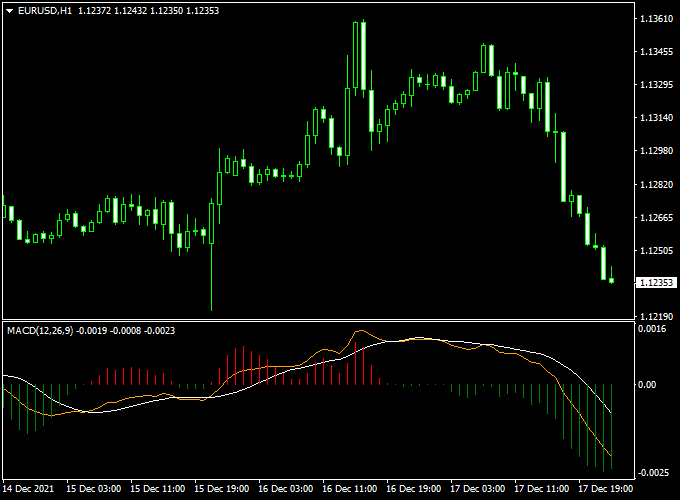
Indicator Chart (EUR/USD H1)
The example chart below shows the Double MACD applied to a EURUSD H1 chart.

Buy and Sell Trading Rules
General idea
Use the Double MACD to take trades only when both the short-term (fast) MACD and the long-term (slow) MACD agree on direction.
This reduces false signals and improves trade consistency.
Buy Rules
- Entry: The MACD histogram turns green. Open a buy trade.
- Stop Loss: Place stop loss below the most recent swing low or a fixed multiple of ATR (e.g., 1.5 × ATR(14)), depending on timeframe and volatility.
- Take Profit: Use a risk-to-reward ratio of at least 1:1.5, a fixed pip target, or exit the trade when the histogram turns red.
Sell Rules
- Entry: The MACD histogram turns red. Open a sell trade.
- Stop Loss: Place stop loss above the most recent swing high or a fixed multiple of ATR (e.g., 1.5 × ATR(14)).
- Take Profit: Use a risk-to-reward ratio of at least 1:1.5, a fixed pip target, or exit the trade when the histogram turns green.
Trade management tips
- Consider scaling out of positions: close 50% at the first logical target and trail the rest.
- Use higher timeframe alignment — e.g., only take H1 entries when H4 slow MACD confirms direction.
- Combine with price action (support/resistance, structure breaks) to improve entry timing.
Double MACD + Supertrend MTF MT4 Strategy: Momentum with Multi-Timeframe Confirmation
This strategy combines the Double MACD Forex Indicator and the Supertrend MTF Forex Signal Indicator for MT4.
It is designed for traders who seek to capitalize on strong market momentum with multi-timeframe trend confirmation.
By using the Double MACD to identify momentum shifts and the Supertrend MTF to confirm the overall trend direction, this approach aims to enhance trading accuracy and profitability.
Buy Entry Rules
- Momentum Confirmation: Enter a buy trade when the Double MACD indicator shows red histogram bars, indicating upward momentum.
- Trend Confirmation: Ensure that the Supertrend MTF indicator is green on both the current and higher timeframes, confirming an uptrend.
- Stop Loss Placement: Place the stop loss below the most recent swing low or a predefined percentage of the entry price.
- Take Profit Setting: Set the take profit at a recent swing high or use a risk-to-reward ratio that aligns with your trading plan.
Sell Entry Rules
- Momentum Confirmation: Enter a sell trade when the Double MACD indicator shows green histogram bars, indicating downward momentum.
- Trend Confirmation: Ensure that the Supertrend MTF indicator is red on both the current and higher timeframes, confirming a downtrend.
- Stop Loss Placement: Place the stop loss above the most recent swing high or a predefined percentage of the entry price.
- Take Profit Setting: Set the take profit at a recent swing low or use a risk-to-reward ratio that aligns with your trading plan.
Advantages
- High Probability Trades: Combining momentum and trend confirmation increases the likelihood of successful trades.
- Multi-Timeframe Reliability: Using higher timeframe trend signals reduces the risk of entering against the market direction.
- Clear Entry and Exit Points: The strategy provides precise signals for both entries and exits, reducing uncertainty.
- Flexibility: Can be applied to multiple currency pairs and timeframes, allowing traders to adapt to different markets.
- Trend-Following Edge: Helps capture strong moves in the market by entering trades in the direction of the prevailing trend.
Drawbacks
- Over-Reliance on Indicators: Solely relying on these indicators without considering other market factors may lead to suboptimal trading decisions.
- Complexity for Beginners: The multi-timeframe analysis may be challenging for novice traders to interpret effectively.
Example Case Studies
Case Study 1: AUD/USD (1-Hour Chart)
On the AUD/USD 1-hour chart, the Double MACD indicator showed a red bullish crossover, signaling upward momentum.
The Supertrend MTF indicator was green on both the current and higher timeframes, confirming the uptrend.
A buy trade was executed at the close of the candle, with the stop loss placed below the recent swing low and the take profit set at a recent swing high.
The trade achieved a 2.8:1 risk-to-reward ratio.
Case Study 2: USD/CHF (4-Hour Chart)
On the USD/CHF 4-hour chart, the Double MACD indicator showed a green bearish crossover, indicating downward momentum.
The Supertrend MTF indicator was red on both the current and higher timeframes, confirming the downtrend.
A sell trade was entered at the close of the candle, with the stop loss above the recent swing high and the take profit set at a recent swing low.
The trade resulted in a 110 pip profit.
Strategy Tips
- Combine with Other Indicators: Enhance the strategy by integrating additional indicators like RSI or MACD for overbought or oversold conditions.
- Use Higher Timeframes: Analyze higher timeframes for trend direction and lower timeframes for precise entry points.
- Risk Management: Always use proper risk management techniques, such as limiting risk to 1-2% of your trading capital per trade.
Download Now
Download the “Double MACD.ex4” indicator for Metatrader 4
Indicator Specifications
| Specification | Detail |
|---|---|
| Platform | MetaTrader 4 (MT4) |
| Indicator Type | Dual MACD — momentum & trend confirmation |
| Inputs / Parameters | Fast EMA1, Fast EMA2, Fast signal; Slow EMA1, Slow EMA2, Slow signal; histogram smoothing; alert on agreement |
| Timeframes | All (recommended M15–H4 for intraday/swing trading) |
| Symbols | Forex majors recommended (EURUSD, GBPUSD, USDJPY, etc.) |
| Recommended use | Entry confirmation, filter for trend-following strategies, swing trades |
| License | Free download for personal use |
FAQ
Does the Double MACD repaint?
No — the indicator uses completed bar values for MACD and histogram calculations.
It does not repaint historical signals; however, live bars remain subject to change until the bar closes.
Can I use this indicator as a standalone strategy?
While the Double MACD gives strong confirmation signals, it’s best combined with price action or structure (support/resistance, trendlines) and proper risk management.
Use a demo account to test settings first.
Which timeframe works best?
It works on all timeframes. Fast intraday scalpers may use M5–M15 with tighter stops; swing traders prefer H1–H4.
Align trades with a higher timeframe MACD for better success.
Summary
The Double MACD Forex Indicator for MT4 is a pragmatic tool for traders who want clearer confirmation by combining short-term momentum with longer-term trend context.
Its dual-MACD design reduces false entries and provides a simple, visual way to check alignment before taking a trade.
To improve results, pair the indicator with sensible risk management (ATR-based stops, position sizing), higher timeframe confirmation, and price-action filters such as support/resistance or candlestick reversal patterns.
Additional improvements could include integrating a dynamic trailing stop based on ATR, adding an option for higher timeframe MACD smoothing inside the indicator, or including a visual dashboard that shows agreement across several pairs and timeframes for faster scanning.


