The Wilder’s Average True Range (ATR) indicator for Metatrader 5 measures market volatility and reveals how volatile a currency pair is at any given moment.
In Forex trading, the indicator is often used for stop loss and take profit calculations.
- During high market volatility periods, wider stop losses and take profit targets will be used.
- During low market volatility periods, narrower stop losses and take profit targets will be used.
The following ATR indicator inputs can be edited: averaging period, colors, and style.
Make yourself familiar with this indicator and test it first on a demo account. It supports all time frames and Forex pairs.
Download Indicator 🆓
Wilder’s Average True Range.mq5 Indicator (MT5)
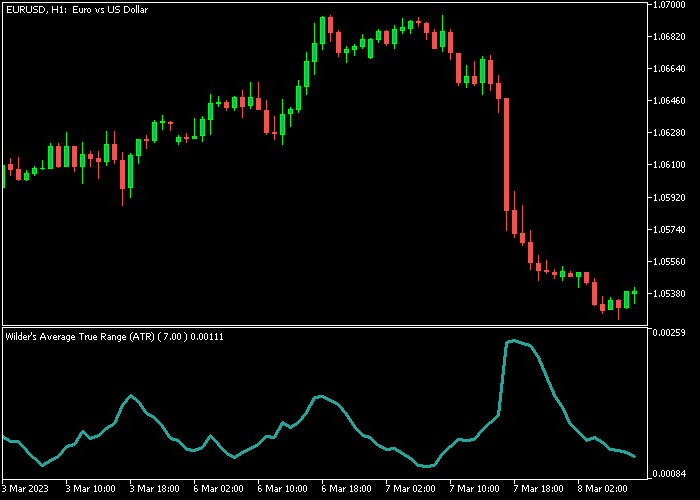
Chart Example
The following chart shows how the Wilder’s Average True Range (ATR) indicator looks when applied to the MT5 chart.

How To Buy And Sell Forex Pairs With The Wilder’s Average True Range (ATR) Indicator?
The Wilder’s Average True Range (ATR) indicator does not generate any buy and sell signals.
It only measures and displays market volatility for any currency pair.
Combine the ATR indicator with other technical tools to create a complete Forex trading solution.
Download Now 🆓
Wilder’s Average True Range.mq5 Indicator (MT5)
Frequently Asked Questions
How Do I Install This Custom Indicator On Metatrader 5?
- Open the MT5 trading platform
- Click on the File menu button located at the top left part of the platform
- Click on Open Data Folder > MQL5 folder > Indicators
- Copy the Wilder’s Average True Range.mq5 indicator file in the Indicators folder
- Close and restart the trading platform
- You will find the indicator here (Navigator window > Indicators)
- Drag the indicator to the chart to get started with it!
How Do I Edit This Indicator?
- Click in the open chart with your right mouse button
- In the dropdown menu, click on Indicator List
- Select the indicator and click on properties
- Now you can edit the inputs, colors, levels, scale and visualization
- Finally click the OK button to save the new configuration


