The RSI + SAR Forex Scalper indicator for Metatrader 5 identifies multiple trade opportunities for scalpers daily.
The indicator is composed of the RSI and SAR technical indicators.
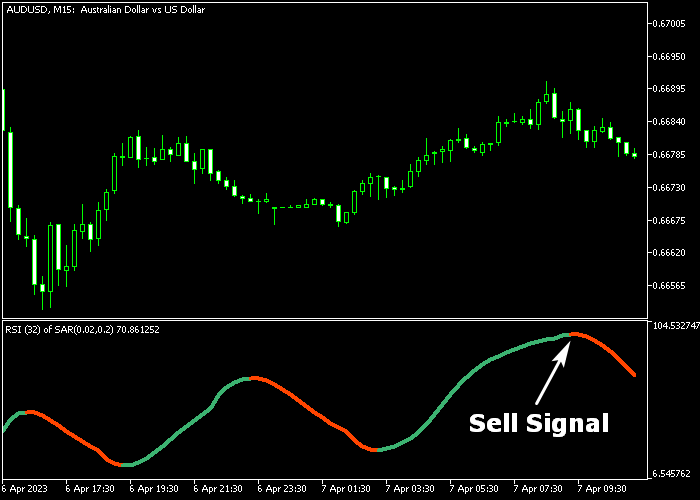
It shows up in a separate chart window as a dual-colored line that provides buy & sell signals.
- The green line is a buy trade.
- The red line is a sell trade.
The best trade results will be achieved in the volatile London and New York trading sessions.
We aim for 8-25 pips profit per trade (profit target depends on the chosen time frame).
The indicator contains the following inputs and parameters: RSI period, SAR step, SAR maximum, style, and colors.
Feel free to experiment with the various indicator input settings!
First, familiarize yourself with this technical indicator and test it on a demo account.
It supports all time frames and Forex pairs.
Download Indicator 🆓
Chart Example
The following chart shows what the RSI + SAR Forex Scalper indicator looks like when applied to the MT5 chart.

How To Buy And Sell Forex Pairs With The RSI + SAR Forex Scalper Indicator?
Find a simple trading example below:
Buy Signal
- The start of the green colored signal line is your long trade entry price.
- Open a buy trade and set your initial stop loss below short-term support.
- Exit the buy trade for 8-25 pips profit per trade.
Sell Signal
- The start of the red colored signal line is your short trade entry price.
- Open a sell trade and set your initial stop loss above short-term resistance.
- Exit the sell trade for 8-20 pips profit per trade.
Download Now 🆓
Frequently Asked Questions
How Do I Install This Custom Indicator On Metatrader 5?
- Open the MT5 trading platform
- Click on the File menu button located at the top left part of the platform
- Click on Open Data Folder > MQL5 folder > Indicators
- Copy the RSI (sar).mq5 indicator file in the Indicators folder
- Close and restart the trading platform
- You will find the indicator here (Navigator window > Indicators)
- Drag the indicator to the chart to get started with it!
How Do I Edit This Indicator?
- Click in the open chart with your right mouse button
- In the dropdown menu, click on Indicator List
- Select the indicator and click on properties
- Now you can edit the inputs, colors, levels, scale and visualization
- Finally click the OK button to save the new configuration


